What R-multiples are and why they matter
If you risk €100 on a trade and make €300, that outcome is +3R. If you lose €50 on a trade that had €100 at risk, that’s -0.5R. R is simply your initial risk per trade, and an R-multiple expresses every result in units of that risk. The idea was popularized by Dr. Van Tharp and it’s loved by day traders because it standardizes performance across symbols, position sizes, and price levels. When you think in R, a 1.2% scalp in futures and a €0.35 move in a stock can be compared on the same scale, and your journal becomes robust to changing volatility or sizing.
Most traders pair R-multiples with a fixed-fraction position sizing rule (for example, risk 1% of equity per trade) so the “R” stays consistent as account size moves up or down. This turns chaotic P/L into a clean distribution of R-results you can analyze and improve.
Expectancy in plain English
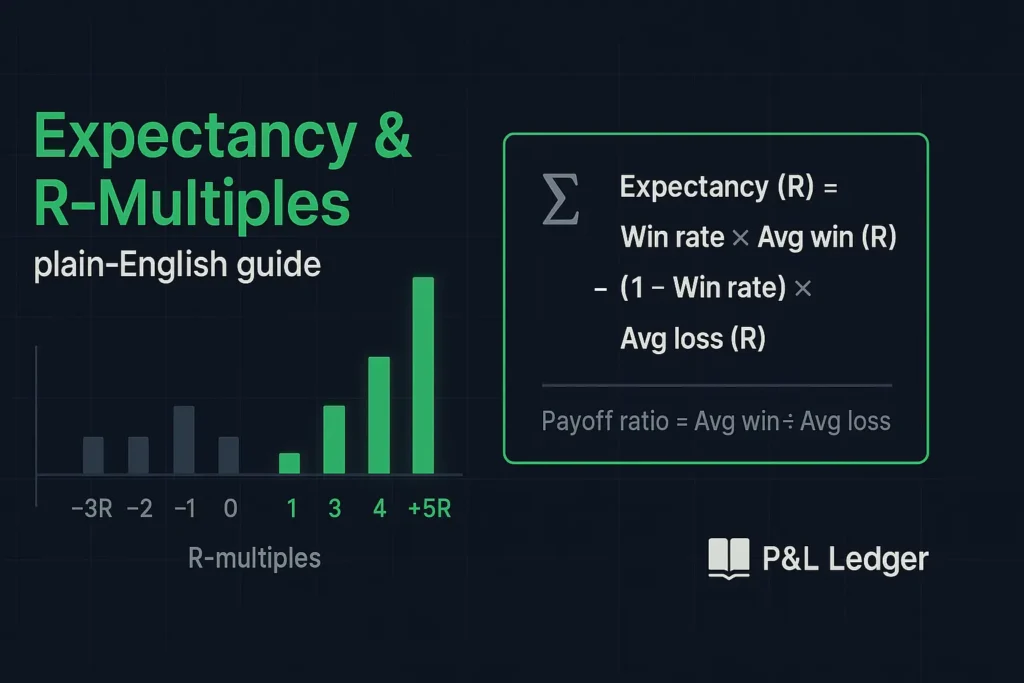
Expectancy answers a simple question: on average, how much do you make or lose per trade? The formula is intuitive: Expectancy = (Win rate × Average win) − [(Loss rate) × Average loss]. In words, it’s your wins weighted by how often you win, minus your losses weighted by how often you lose. Many platforms and textbooks discuss this same idea under “average profitability per trade,” and it’s a better compass than fixating on hit rate or profit/loss ratio alone. You can have a beautiful win rate and still bleed out if your average loss is much larger than your average win. You can also be right less than half the time and still come out ahead if your winners meaningfully exceed your losers. Expectancy reframes the strategy from “how often am I right?” to “what is my average outcome when I execute the plan repeatedly?”
Expectancy in R-terms (the tidy version you’ll actually use)
Because R-multiples normalize outcomes, you can compute expectancy directly in R. Let p be your win rate, AvgWinR your average R-multiple on winning trades, and AvgLossR your average on losing trades (a negative number by definition). Then Expectancy in R = p × AvgWinR + (1 − p) × AvgLossR. That’s it. Work in R and you no longer need to reconcile different tick values, contract sizes, or mixed position sizing, you just need a consistent definition of initial risk and a clean journal.
This is also where good position sizing meets good math: when you standardize risk per trade, the expectancy figure becomes “per trade edge” that scales smoothly with frequency. If your day-trading playbook produces +0.20R on average and you can execute 5 valid trades per day, your plan has a path to +1R/day before slippage, fees, and mistakes.
Reading your data like a pro
Once you log trades in R, patterns pop out. For example, you might discover that your first hour entries win more often but cap out at +0.8R, while late-session continuation entries win less often but print occasional +3R runs. Expectancy connects those behaviors in one number, while R-multiples tell you where the number comes from. You can also cross-check with related metrics: payoff ratio in R (AvgWinR / |AvgLossR|) and profit factor in R (sum of positive R divided by the absolute sum of negative R).
Just remember that single metrics can mislead when sample size is small or dispersion is lumpy, which is why seasoned traders prioritize a sufficiently large set of trades and keep an eye on execution costs and platform definitions. If your platform or journal tool shows expectancy in currency, you can always recover the tidy version by dividing by your per-trade risk to get expectancy in R.
Grab the sheet and start logging
We made a simple, no-nonsense Excel sheet so you can track trades in R and see expectancy update automatically. In the Data tab, log the date, ticker, setup, your “RiskPerTrade” in currency, and your realized P/L for that trade. The sheet computes the R-multiple as P/L divided by RiskPerTrade and tags the outcome as W or L. The Summary tab then rolls up win rate, average win R, average loss R, payoff ratio, profit factor, cumulative R, and expectancy in R. Keep your risk per trade consistent to get clean numbers. If you change risk sizing mid-stream, the R math still holds, but your comparisons become tighter when each trade’s “R” truly reflects initial risk.
Aim for enough trades to make the averages meaningful, and let the sheet guide small, steady tweaks rather than wholesale overhauls after a noisy day.
Download Expectancy R template
A final mental model for day traders
Expectancy measures edge. R-multiples measure outcomes, position sizing decides how that edge compounds. If you journal in R and review expectancy weekly, you’ll spot whether you’re relying on frequent tiny scalps that crumble during spread widening, or on occasional big outliers that demand iron discipline in flat periods. Neither style is “better” in the abstract. The better style is the one whose win-rate and payoff mix you can execute without deviating when markets speed up or slow down. Stay consistent with risk, think in R, watch expectancy, and let the data nudge your rules toward clarity and repeatability. That’s how a day-trading tactic turns into a durable process.