To read your strategy honestly, you need three lenses: win rate (the percentage of winning trades), payoff ratio (average win divided by average loss), and profit factor (gross profit divided by gross loss).
Day traders often talk about win rate as if it were a badge of honor, but a high hit rate can hide a weak edge if your average loss dwarfs your average win. I learned that the hard way early on. To read your strategy honestly, you need three lenses: win rate (the percentage of winning trades), payoff ratio (average win divided by average loss), and profit factor (gross profit divided by gross loss). Win rate only tells you how often you’re right.
Payoff ratio tells you how much you make when you’re right versus how much you give back when you’re wrong. Profit factor rolls up the entire trade history and compares the total of all wins to the total of all losses – anything above 1 implies the system made more than it lost over the period tested. These definitions are simple, but they frame very different behaviors in a strategy, and learning to read them together is what turns raw results into useful insight.
How they connect: the math that links them
The three aren’t independent. If you know any two, you can work out the third. Start with profit factor (PF). Let p be your win rate and R be your payoff ratio (average win / average loss). If losses occur a fraction (1 − p) of the time, then PF equals (p × R) / (1 – p). Rearranging gives p = PF / (PF + R), which shows a clear trade-off: for a given PF, raising the payoff ratio allows a lower win rate, and lowering the payoff ratio demands a higher win rate. That’s why strategies that scalp small gains need a high hit rate, while trend-following approaches can live with fewer winners if the winners are multiple times larger than the losers. To anchor this in numbers, a 40% win rate with a 2:1 payoff has PF = 0.4 × 2 / 0.6 ≈ 1.33. A 60% win rate with a 0.8:1 payoff gives PF = 0.6 × 0.8 / 0.4 = 1.20. Same market, different style, different balance.
Expectancy: the glue that keeps you honest
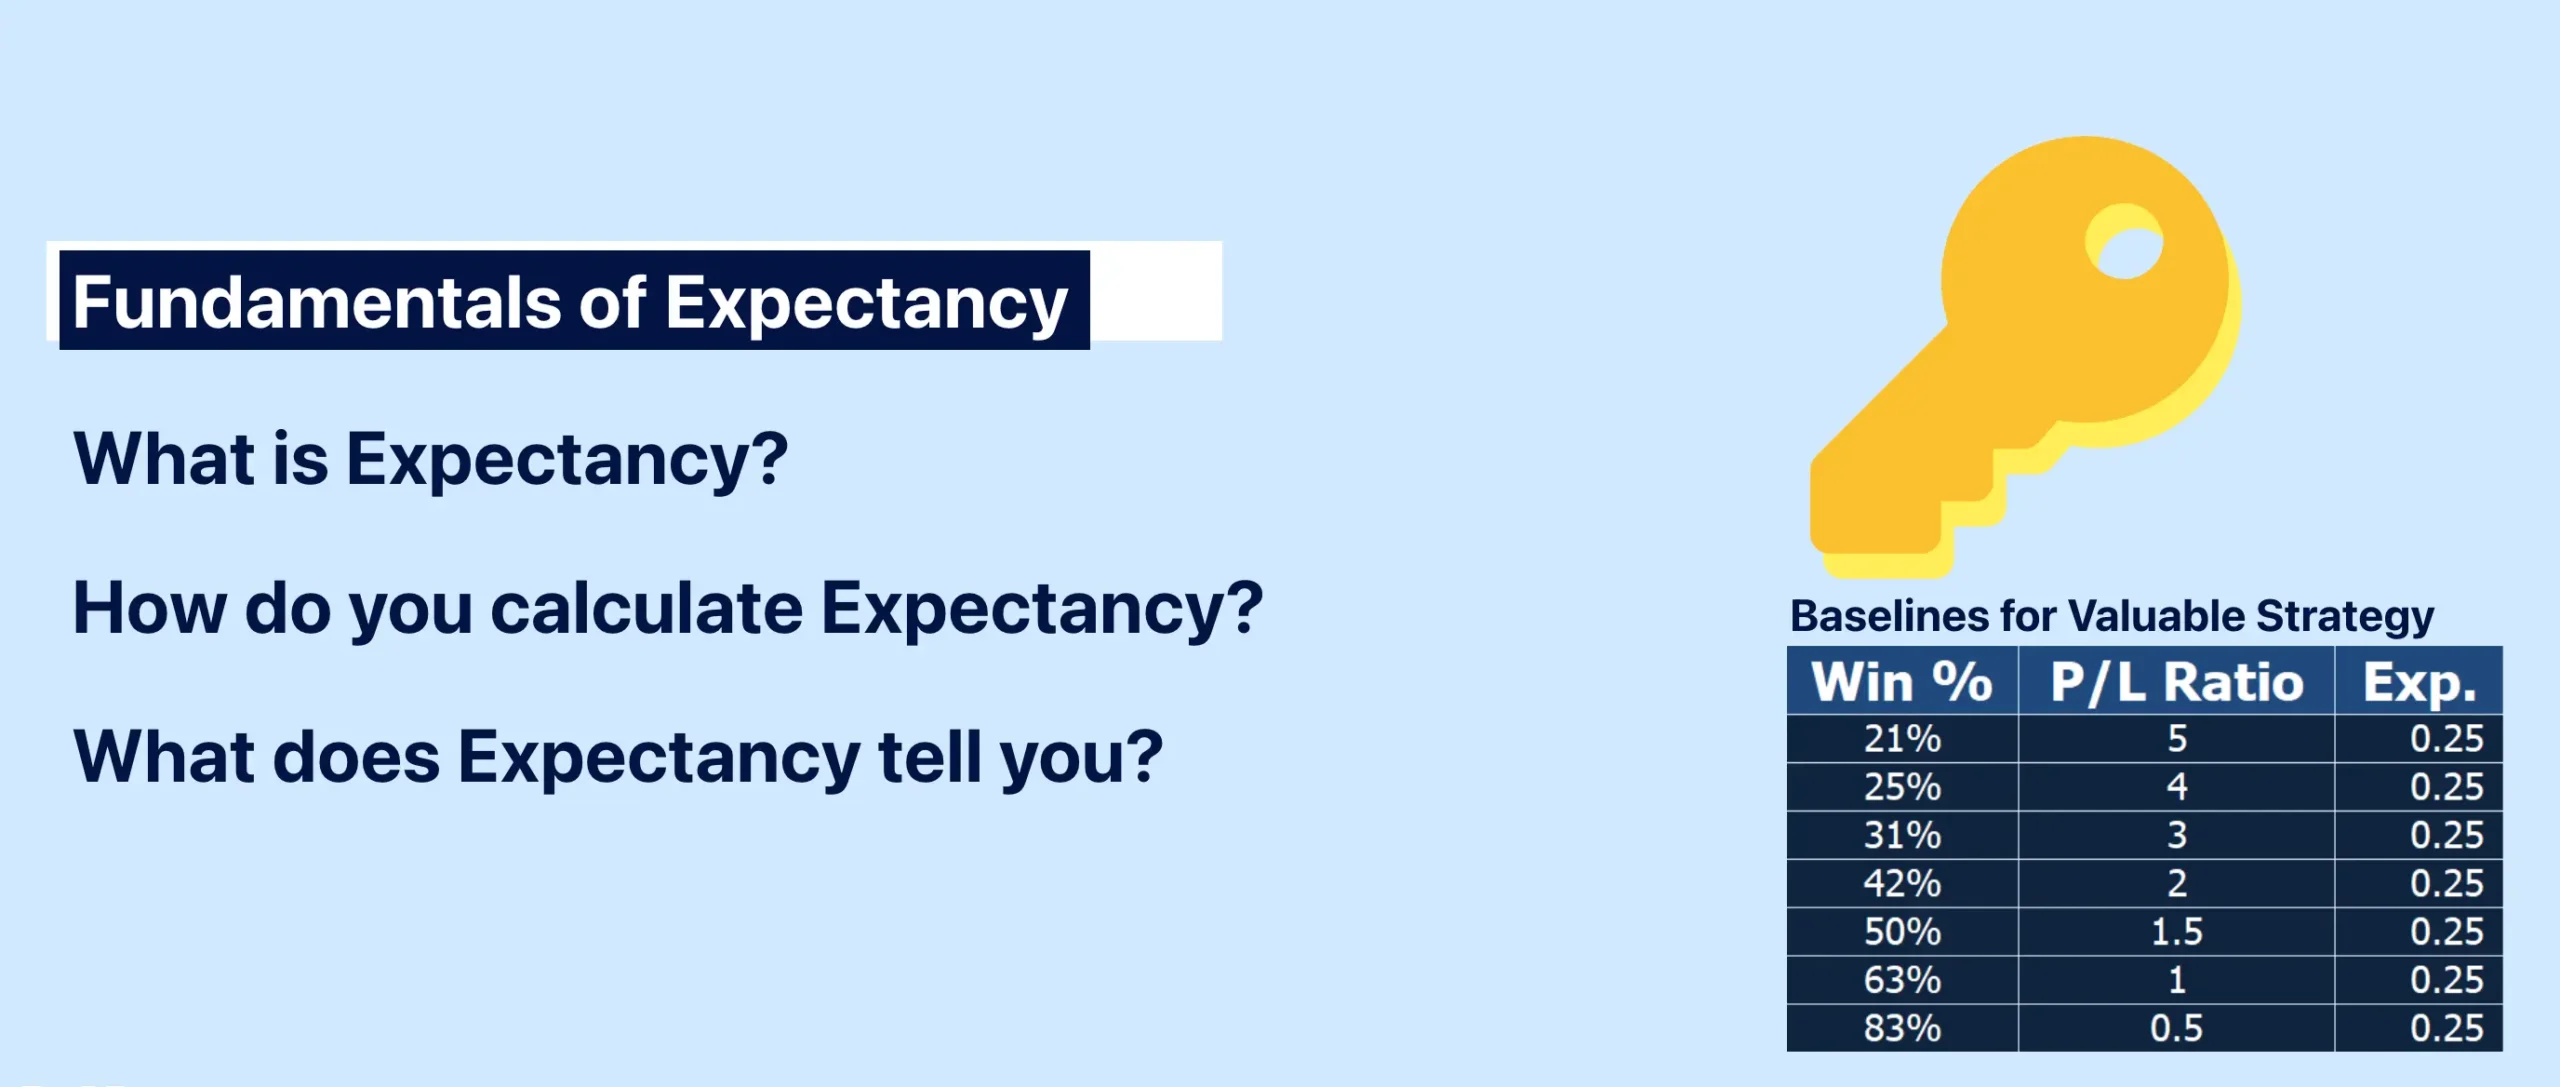
Expectancy ties the trio to “what you earn on average per trade.” It’s the weighted average of outcomes: Expectancy = (Win rate × Average win) − [(1 − Win rate) × Average loss]. If you divide both average win and average loss by the loss size, you’ll see expectancy in “R” terms: Expectancy in R = p × R − (1 − p). This is why focusing on win rate alone can mislead you; a 75% win rate still loses money if the average loss is three times the average win, while a 35% win rate can produce a positive average outcome if winners are many times larger than losers.
In practice, traders monitor expectancy alongside profit factor because PF compresses the entire sample while expectancy describes the average per trade. Both depend on stable estimates of average win and loss, so they improve with more trades and consistent risk sizing. If you only look at one metric, you risk optimizing for the wrong behavior, either chasing frequent tiny wins that get erased by a rare outsized loss, or swinging for the fences and suffering long cold streaks you didn’t budget for.
Profit factor’s sweet spots and blind spots for day trading
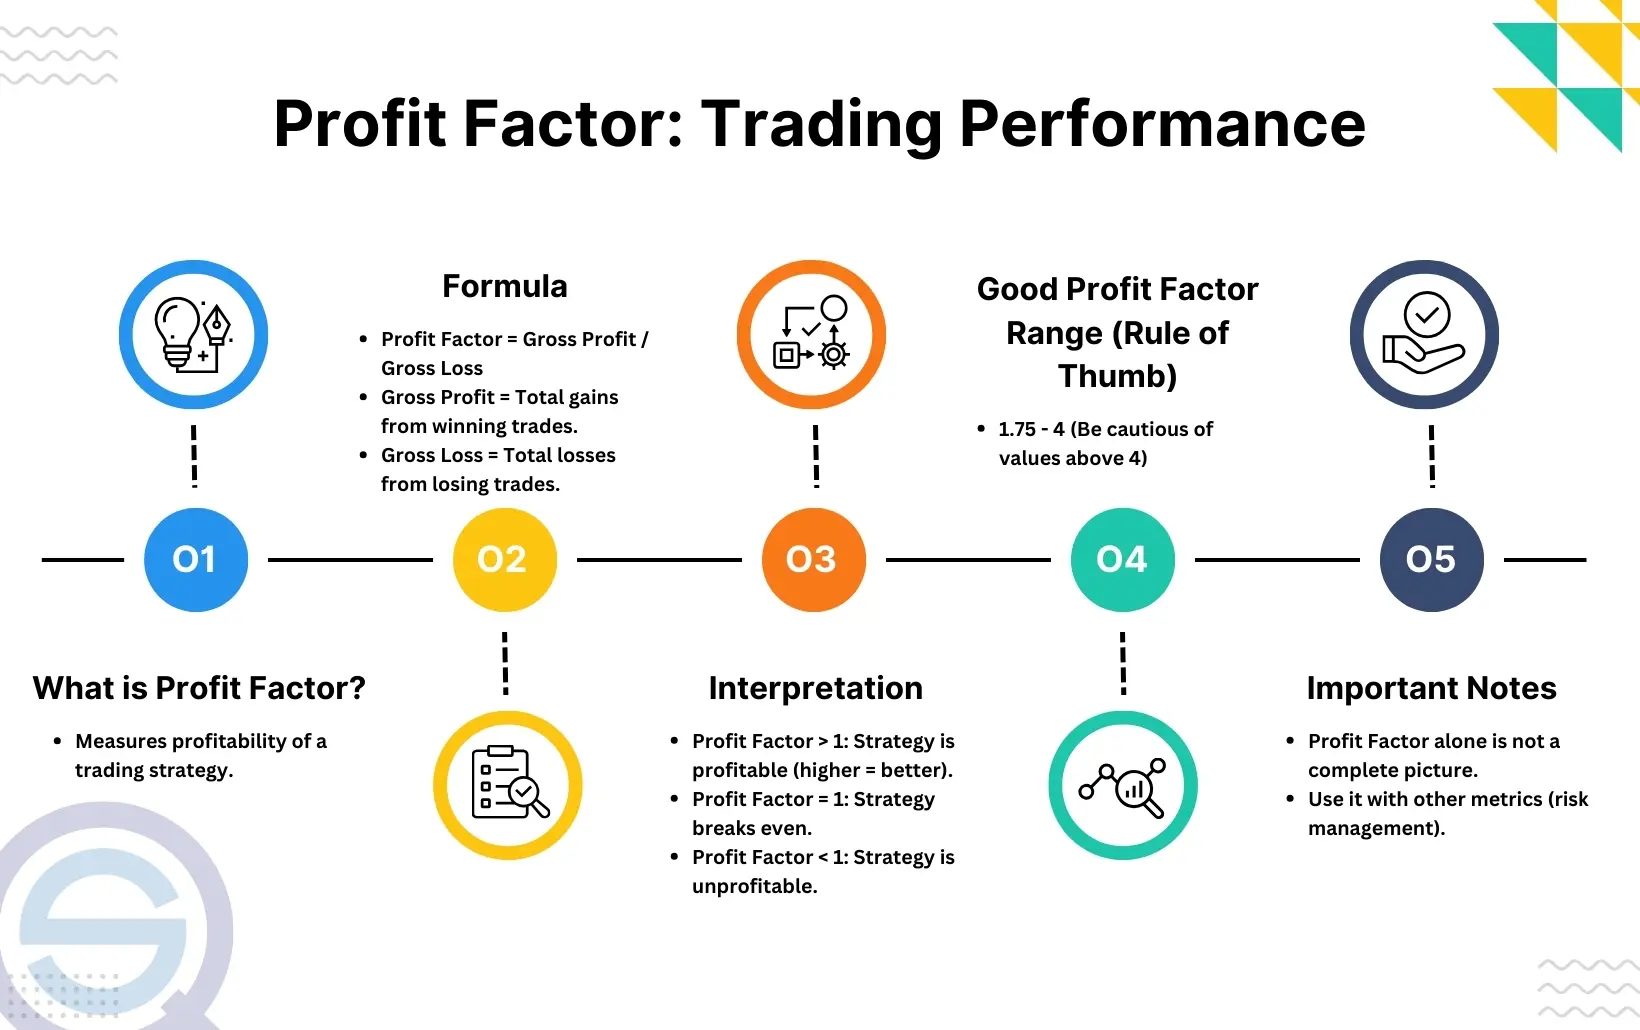
PF over 1 signals a profitable backtest, and higher values usually point to healthier systems. But context matters. Profit factor doesn’t show dispersion: a PF of 1.5 could come from a smooth series of small edges or from a lumpy mix of many small losses and a few massive wins. It also depends on sample size; with only a handful of trades, a single outlier can inflate PF, while a larger sample gives a more reliable read.
On top of that, different platforms compute gross profit and gross loss the same way, sum of winners and sum of losers – but they may exclude open trades or treat commissions differently, so read the fine print when you compare reports. Treat PF as the big-picture ratio, then use win rate and payoff ratio to understand why the number is what it is and whether that behavior matches your style and psychology during fast intraday sequences.
Turning the trio into decisions you can trade
A simple way to apply this: fix your maximum loss per trade first, because that stabilizes the “L” in both payoff ratio and expectancy. Design entries and exits around a realistic target relative to that loss. This gives you an intended payoff ratio before you place a single trade. Then track your realized win rate and average outcomes over a meaningful sample, update PF and expectancy, and compare behavior to your plan.
If your payoff shrinks under slippage or partial fills, your required win rate rises. If your win rate slides during chop, you might need to widen profit targets or trim losses faster to restore PF. Two systems can print the same PF but feel very different to trade, one might win often with tiny gains, the other might grind through strings of small losses before a big runner. Neither is “better” in the abstract. The “better” system is the one whose win-rate/payoff mix you can execute consistently, because consistency is what keeps expectancy positive over hundreds of intraday decisions.