What max drawdown actually measures
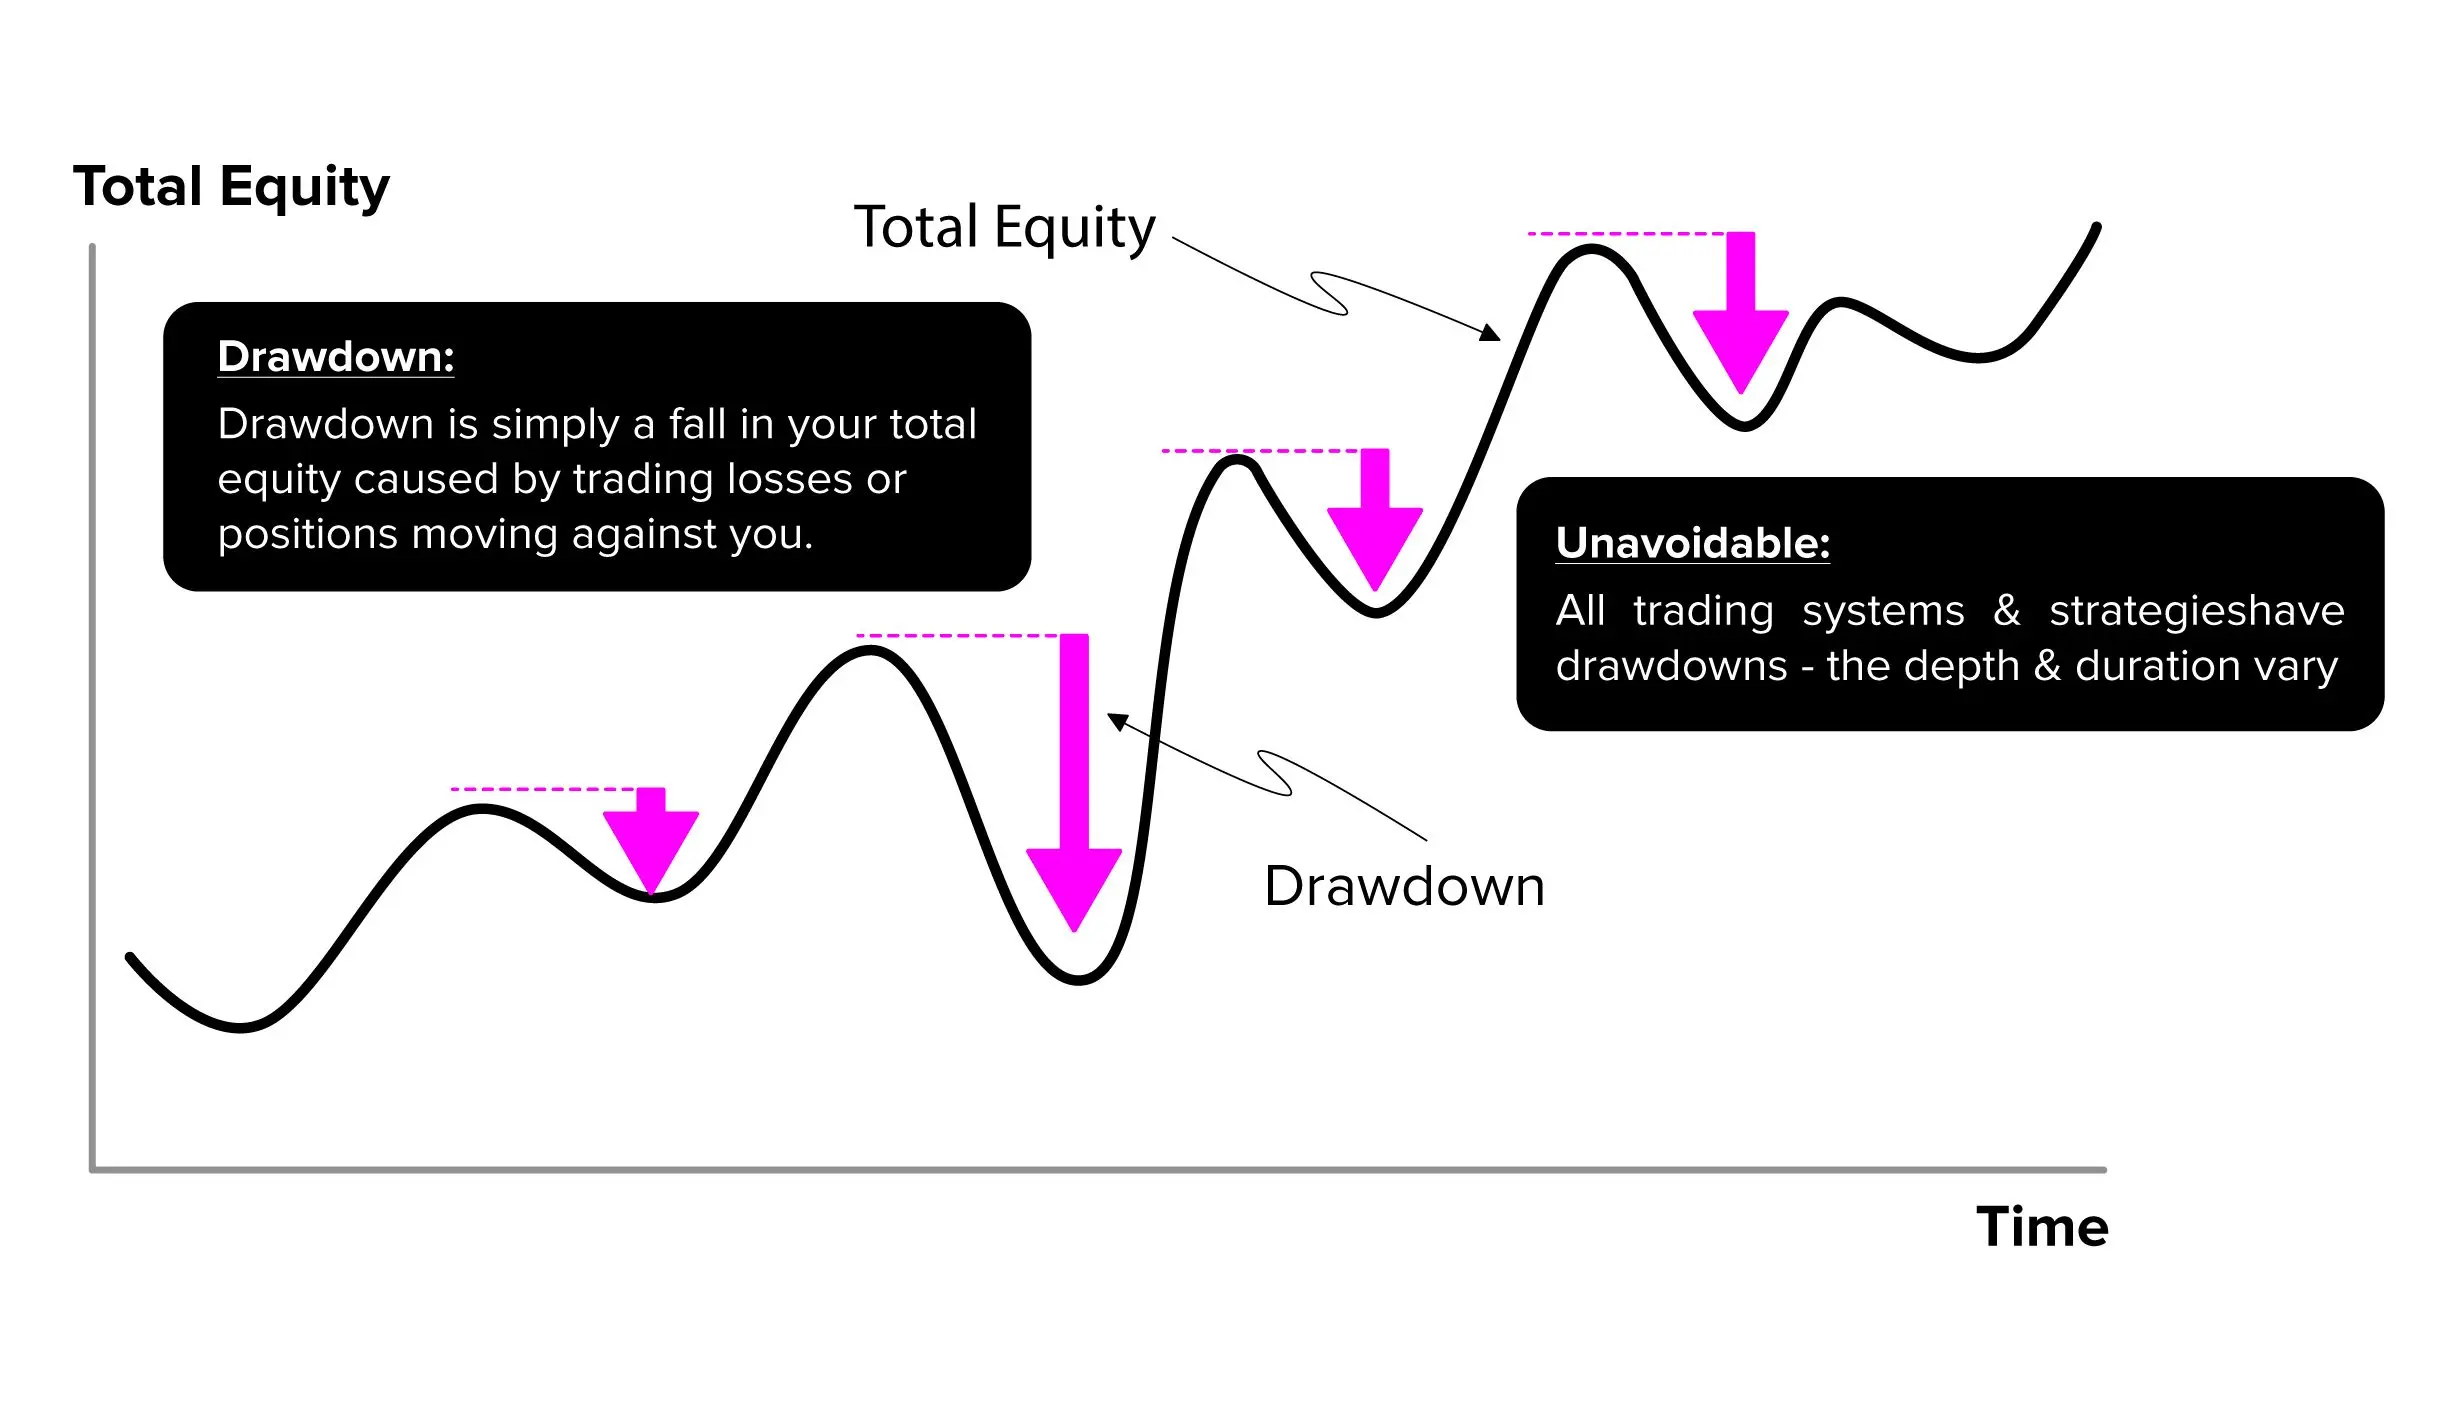
Max drawdown is the single worst peak-to-trough fall in your equity before a new high is made. Think of your equity curve as a coastline with rising tides, drawdown is how far the water recedes from the latest high-water mark, and maximum drawdown (MDD) is the deepest retreat seen over the period you’re measuring. It’s expressed as a percentage of the prior peak and, unlike a simple loss, it’s path-dependent. You can be in a deep drawdown even if you’re still above your initial starting balance. MDD focuses on the size of the biggest loss, it does not tell you how often losses occur or how long recovery takes, which is why many traders also track ‘time under water’ (the time from a peak until you make a new one).
The simple math behind it
At any time, track your running high-water mark. Drawdown at time t is the distance from that peak to current equity. Max drawdown is the largest of those distances in your sample. In code or a spreadsheet, you update the peak when a new high occurs and compute percentage drops from that peak. MDD is the maximum of those. It’s simple, transparent, and reproducible. Your personal MDD depends on entry/exit rules, leverage, and discipline – not on the ticker alone.
Why day traders should care
Two ideas help frame recoveries. First, track time under water alongside MDD so you know how long your typical recovery takes. This shapes your expectations and prevents rule-breaking during normal cold spells. Second, remember recovery math is nonlinear: after a 50% drawdown, you need a 100% gain just to get back to even. That asymmetry is why day traders obsess over cutting the left tail – small differences in maximum loss translate into big differences in recovery burden.
In practice, reduce MDD by standardizing risk per trade, avoiding ‘double-up’ behavior after losses, and sizing down or stopping when volatility or slippage pushes your outcomes outside their usual range. Over a large enough sample, that discipline compresses your worst peak-to-trough and shortens the time you spend underwater.
Intraday vs. end-of-day drawdown
For day traders, it helps to track two views: intraday equity drawdown (including open P&L swings) and closed-trade drawdown (end-of-day or after each exit). Intraday tracking captures heat you took while positions were open, closed-trade tracking shows realized damage. Both use the same mechanics – peak-to-trough on your equity curve, but answer different questions about risk and stress.
MDD versus daily loss limits
MDD is historical: the worst hole so far. Daily loss limits are operational, a rule that stops you trading for the session once you’re down a set amount (e.g., 1–3% of account). Prop firms formalize this with daily loss and overall drawdown rules – breach them and you’re flat for the day or the account is closed. Adopting similar guardrails in a personal account preserves capital and discipline.
Why max drawdown matters and where it falls short
MDD is a crisp way to communicate downside: two strategies with the same average return can feel very different if one has a 6% MDD and the other has 25%. It also underpins risk-adjusted metrics you’ll see in reports. The Calmar ratio compares annualized return to maximum drawdown, so higher Calmar means more return per unit of worst-case pain. Return over Max Drawdown (RoMaD) uses the same idea.
Still, MDD alone ignores duration, a quick 15% dip that recovers in a week and a 15% hole that lasts months have the same MDD. Measures like the Ulcer Index explicitly combine depth and time spent below peaks, which can help day traders who care about how long they’re stuck digging out. Use MDD as your headline downside number, then read it alongside duration-sensitive metrics.
Practical guardrails you can apply today
Write MDD boundaries into your plan: a max daily loss, a weekly stop (pause after a preset drawdown or three consecutive losses), and per-trade risk that keeps worst-case daily heat tolerable. Re-scale size when your equity falls so one bad day can’t snowball into a fatal spiral. Track MDD alongside win rate, expectancy, and slippage, and review after meaningful sample sizes – not after a handful of trades.
The takeaway
Max drawdown is the clearest snapshot of downside pain. Measure it on your own equity curve, monitor how quickly you recover, and size positions so your planned drawdown is survivable without breaking rules or psychology. Treat MDD as a budget for mistake. Protect it with daily stops, avoid revenge sizing during losing streaks, and let risk-adjusted metrics tell you whether returns are worth the ride.