Why this table matters in real trading
When traders discuss good win rates or solid risk:reward (R:R), they often treat them as separate dials. They aren’t. For any planned trade you can compute the minimum win rate needed to avoid losing money at a given risk:reward. That minimum is the break-even win rate, and it drops fast as your reward gets larger relative to your risk.
A setup targeting three times your risk only needs to win a quarter of the time to break even, while a one-to-one idea needs to win half the time. Thinking this way helps you judge whether your target and stop are aligned with how often your pattern actually wins in your PnL journal. It also gives you a calm yardstick when markets speed up or slow down: adjust one dial and know exactly how the other must respond to keep you afloat.
The one-line formula (and where it comes from)
The break-even win rate is just a tidy rearrangement of the expectancy equation. Expectancy says your average result per trade equals your win rate times average win minus your loss rate times average loss. If you set expectancy to zero and define R as the reward-to-risk ratio (average win divided by average loss), the algebra collapses to a single line:
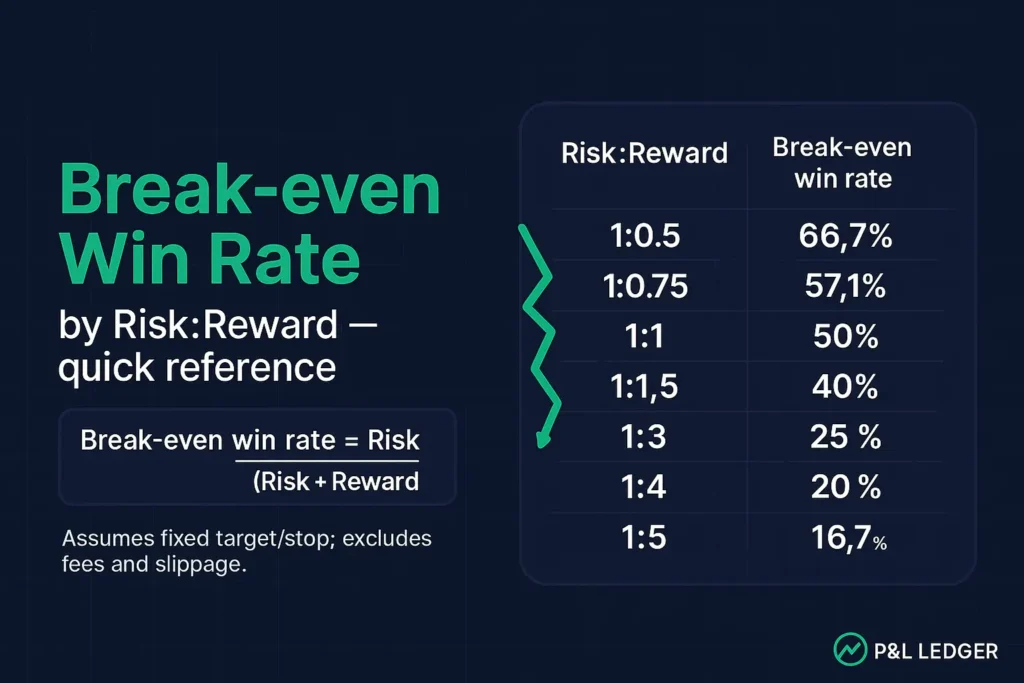
break-even win rate = 1 / (1 + R).
At R = 3, the math gives 1 ÷ 4 = 0.25, or 25%. At R = 2, it’s 1 ÷ 3 = 33.33%. Seeing the relationship this cleanly turns ‘gut feel’ into a simple check you can do before you click buy or sell. If your journal’s realized win rate sits below the break-even line for the R you’re targeting, the plan needs a change in targets, stops, or selectivity.
Quick reference table you can use today
Here’s a plain table you can glance at on your second monitor. Read it as ‘if I target this reward relative to my risk, I need at least this win rate to not lose money before costs’. Values come straight from the formula above. If you’re a scalper taking smaller wins, notice how the required hit rate climbs. If you’re hunting bigger moves, the required hit rate falls but variance rises. The smartest use is to pair this table with your own data. Look at your actual win rate by setup and choose targets that sit on the right side of break-even for your stats, not someone else’s screenshots.
| Risk:Reward | Break-even win rate |
|---|---|
| 0.25 : 1 | 80.00% |
| 0.33 : 1 | 75.19% |
| 0.50 : 1 | 66.67% |
| 0.75 : 1 | 57.14% |
| 1.00 : 1 | 50.00% |
| 1.25 : 1 | 44.44% |
| 1.50 : 1 | 40.00% |
| 2.00 : 1 | 33.33% |
| 2.50 : 1 | 28.57% |
| 3.00 : 1 | 25.00% |
| 3.50 : 1 | 22.22% |
| 4.00 : 1 | 20.00% |
| 5.00 : 1 | 16.67% |
If you like working from spreadsheets, grab the downloadable CSV or Excel and filter to the ratios you actually trade.
Costs, slippage, and partial exits: nudging the line upward
Real fills aren’t free. Commissions, fees, and slippage raise the bar because wins are a bit smaller than planned and losses a bit larger. A simple way to account for that is to plug costs into the expectancy step before you derive the break-even rate. If W is the average win, L the average loss, and c the per-trade costs, the zero-expectancy condition becomes p × (W − c) − (1−p) × (L + c) = 0, which rearranges to p = (L + c) / (W + L). If you express W as R×L, you’ll see costs effectively increase the numerator, so the required win rate is slightly higher than 1/(1+R).
Some calculators let you enter costs directly, which is handy when trading products with exchange and clearing fees or when you’re scaling out of positions and paying the spread multiple times. The spirit is the same: your true break-even lives a little above the clean table, and the faster you trade, the more that gap matters.
Turning the table into decisions you can execute
Use the table as a pre-trade filter and a post-trade audit. Before entry, estimate the realistic target and stop to get your intended R and check whether your strategy’s actual win rate clears the break-even row by a healthy margin. After a sample of trades, compare realized R outcomes with the plan. If your average win keeps landing short of the intended target, your effective R is lower, which raises the required hit rate. Either tighten the stop to restore R, widen the target only when structure allows, or get more selective.
If your win rate slumps during chop, downsizing risk can keep your equity curve intact while you wait for conditions that match your R profile. This is the practical loop that keeps traders from forcing a 1:3 fantasy in markets that are paying 1:1.5 today. Definitions of risk:reward vary a bit across sources, but the core idea – distance to target versus distance to stop, remains consistent and is the anchor for everything above.